The Task Overview page is a tool to enable you to dial in on your Work Order Management system and understand important, detailed information about the progress of tasks across your organization. Let’s break down this page and the contents contained within it.
First, in the top right hand corner you’ll find two tools; the Date Range Selector and the Export option.
- Date Range Selector: Upon initial page load, the date range selector will highlight the last 30 days of tasks and task highlights. By clicking on the date range selector, however, you’ll be presented with a number of options that include the last 30 days, the last 3 months, the last 6 months, and the last year. You can also customize this by selecting your own date range. Simply use the arrows at the top of the date range selector to scroll between months. Then, click a start and finish date to set your custom range
- Export Button: The Export Button enables you to download a .pdf file of the current dashboard data.
Statistics Summary (Top KPI Cards)
At the top of the page, beneath the Date Range Selector you’ll see a row of reporting widgets. This row contains key performance indicators for your leadership team, enabling you to get a quick snapshot in time of how your team is performing. Here’s a table of each of these reporting modules and what’s each represents.
|
Metric |
Value |
Trend |
Description |
|
Total Tasks |
x |
+/- % |
Total number of tasks (over the selected range) |
|
Draft |
x |
+/- % |
Tasks saved as draft |
|
In Progress |
x |
+/- % |
Tasks currently being worked on |
|
Blocked |
x |
+/- % |
Tasks facing issues or blockers |
|
Completed |
x |
+/- % |
Tasks successfully completed |
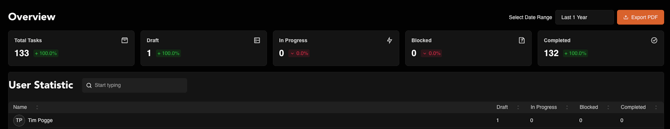
User Statistics Table
The User Statistics Table gives a similar view to the Statistics Summary reporting widgets except in this case it drills down into the details of each individual team member. The first tool associated with the User Statistics Table is the search bar, which enables filtering users by name. Under that, you’ll see the User Statistics Table itself which will be broken down by the following:
Table Columns:
|
Name |
Draft |
In Progress |
Blocked |
Completed |
|
Example Name |
20 |
1 |
2 |
10 |
- Pagination Control: Indicates multiple pages (you’re on page 1 of 10).
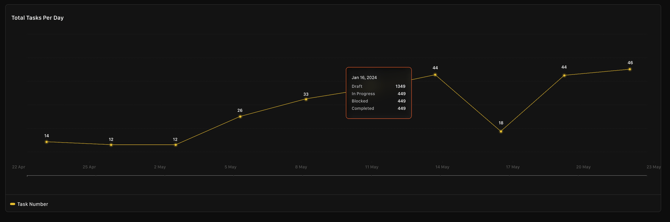
Task Trends Chart
Finally, at the bottom of the Task Overview Page you’ll find the Task Trends Chart. The Task Trends chart shows the daily trend of total tasks per day. By highlighting a current day in time, you can also get detailed information on any given day on Tasks that are in Draft, In Progress, Blocked, etc. Here’s a brief breakdown:
- Graph Type: Line graph showing number of tasks per day.
- Hovering over each date will show a popup modal that shows:
- Draft: Total
-
- In Progress: Total
-
- Blocked: Total
-
- Completed: Total
- The X-Axis on this graph show by dates while the y-axis: count of tasks per day
The Task Overview Page is a great reporting tool that helps empower agency leaders and create meaningful conversations with team members so that agencies can ensure that constituent requests are being handled in a timely fashion. To get additional assistance, please contact support@roadmantech.com.